Sunday, August 26, 2012

The Infovizzy Social Layer

In the current era of big data, it is increasingly expected that there be some way to visualize data in a readily consumable infographic. Figure 1 shows one such example, for the social networking site, LinkedIn, with the infographic web service provided by LinkedIn Maps. The nodes in the social networking fabric are other individuals.
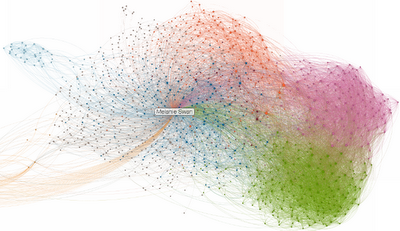


Looking at the figure, some of the aspects to notice are that this person is interacting in different kinds of communities. One of the kinds of communities is clusters that have some high degree of central linkage (the pink and green clusters on the right). Another kind of community is those where the connected people are themselves more broadly linked (the majority of the fabric, around the name box). The farther away communities in the infographic are separated by time (graduate school), and distance (different geographical continents).

However, all of this could be misleading, because the algorithms applied to execute the visualization might not be the most accurate mapping of the relationships with this person and these communities in real life. Also the visualization has an inherent relativism that may result in bias. The infographic is indicative of this person’s relationships in those communities, not conclusive information about the communities themselves.

This kind of infovizzy display could be extended as a digital anthropology tool for viewing the overlaid networks of whole communities. More complete inferences could then be made regarding the closeness and closedness, expansivity, density, breadth, volume, fluidity, and connectedness of different communities. Time lapse analysis could show how and how fast communities grow and fade, especially assessing which kinds of new elements come into communities to sustain and broaden them. Performance metrics for the quality of output of communities could be developed, where relevant.

Sunday, August 19, 2012

Supercomputing: 16 petaflops, schmetaflops?

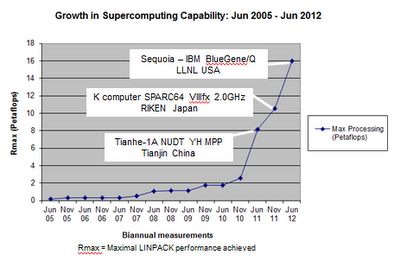
Supercomputing advances continue to exponentiate – the world’s best machine (IBM’s Sequoia - BlueGene/Q installed in the U.S. at LLNL) currently has 16 petaflops of raw compute capability.

Figure 1. Data Source: Top 500 Supercomputing Sites


As shown in Figure 1, the curve has been popping – up from 2 to 16 petaflops in just two years! However for all its massivity, supercomputing remains a linear endeavor. While the average contemporary supercomputer has much greater than human-level capability in raw compute power, it cannot think, which is to say pattern-match and respond in new situations, and solve general rather than special-purpose problems.

For the future of intelligence and cognitive computing, the three-way horse race continues between enhancing biological human cognition, reverse-engineering and simulating the human brain in software, and hybrids of these two.


Sunday, August 12, 2012

The ‘So What’ Interface – a Prescriptive Layer

When we see a calendar, we know what the information means, and readily map this to potential action-taking. This is not as clear with data displayed from the new era of the Health Internet of Things - the increasingly ubiquitous information climate of consumer biophysical monitoring and quantified self-tracking that surrounds us.

So far the main focus has been on Apple-y/iOS-y design and data visualization in health data streams such as 23andMe genomic data, Fitbit data, the Eatery food diary summarization data, or EKG data tracking across a smartphone screen when held up to the chest. However, we are all still scratching our heads as to what to do as a result of seeing the information.

The Prescriptive Interface
A whole new conceptual category of ‘what to do with this data’ needs to be articulated, named, and implemented – an intuitively-apparent prescriptive layer of suggested action-taking as a result of viewing the data. The two biggest challenges are first, these data streams are only nascently available and therefore meaning has not yet been determined in many cases, and second, there is little effort in determining and implementing a core set of principles for behavior influence and ambient suggestioning. Having these challenges solved could help constitute what is missing in the health data streams but not the calendar – knowing what the information means and what action to take as a result.

Sunday, August 05, 2012

The Rapid Approach of the Health Internet of Things

The efforts of the eHealth movement have been quietly gathering steam for the last five years and are finally fulminating into what could be a significant transformation in the management of health and health care. The most encouraging sign of change is that it consists of not just the usual shiny new technology solutions, but more importantly, structural changes in the public health system:

The 80% slim-down of the doctor’s office visit…

  • Majority of diagnosis is straightforward: It is estimated that in 18/20 cases (per Singularity University FutureMed), diagnosis is straightforward, and could be accomplished via telemedicine.
  • Trend to higher deductible plans: many programs are underway to transfer employees to higher-deductible plans which both reduces costs and puts more of an emphasis on preventive medicine.
Significant progress could be made with these structural changes acting in concert with the new generation of healthtech tools in areas such as:
  • Quantified self-tracking devices, examples: Fitbit, Zeo sleep tracking, Body Media, Pebble Watch, Nike Fuel Band, Basis Watch
  • mHealth (mobile health) apps, examples: The Eatery, MoodPanda, Map My Run, Cardio Trainer