In the current era of big data, it is increasingly expected that there be some way to visualize data in a readily consumable infographic. Figure 1 shows one such example, for the social networking site, LinkedIn, with the infographic web service provided by LinkedIn Maps. The nodes in the social networking fabric are other individuals.
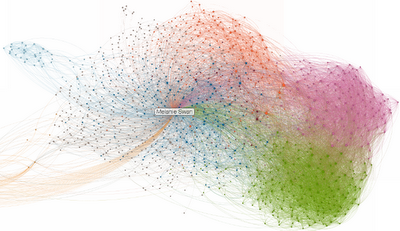
Looking at the figure, some of the aspects to notice are that this person is interacting in different kinds of communities. One of the kinds of communities is clusters that have some high degree of central linkage (the pink and green clusters on the right). Another kind of community is those where the connected people are themselves more broadly linked (the majority of the fabric, around the name box). The farther away communities in the infographic are separated by time (graduate school), and distance (different geographical continents).
However, all of this could be misleading, because the algorithms applied to execute the visualization might not be the most accurate mapping of the relationships with this person and these communities in real life. Also the visualization has an inherent relativism that may result in bias. The infographic is indicative of this person’s relationships in those communities, not conclusive information about the communities themselves.
This kind of infovizzy display could be extended as a digital anthropology tool for viewing the overlaid networks of whole communities. More complete inferences could then be made regarding the closeness and closedness, expansivity, density, breadth, volume, fluidity, and connectedness of different communities. Time lapse analysis could show how and how fast communities grow and fade, especially assessing which kinds of new elements come into communities to sustain and broaden them. Performance metrics for the quality of output of communities could be developed, where relevant.


 Email me
 Twitter
 Subscribe to blog
 MS Futures Group
 Data Visualization Wiki
 Economic Fallacies